All Votes Are Not Counted Equal: A Proportional Cure for EU’s Democratic Deficit

The Lisbon Treaty assigns to each member state a number of seats in the European Parliament based more or less on the relative size of their populations. More for the less, actually. It is well known that small countries are over represented at Strasbourg/Brussels. Each MEP from, say, Malta or Luxemburg, represents around 70-80 thousand of his citizens, while for the bigger countries (DE, FR, UK, IT, ES) there are more than 800 thousand inhabitants for each MEP.
The proportional representation – the method of choice for the EU parliament elections – posits a more or less linear correspondence between votes to political parties and their seats in parliament. Apart from the initial allocation of seats to each country, the proportionality of representation in the EU is further skewed by different turnout rates. For example, Italy and Poland have similar population to seats ratios (slightly above and slightly below 800 thousand, respectively). However, a low turnout in Poland (23 percent, compared with 60 percent in Italy and a EU average of 43) means that each Polish MEP represents approximately 150 thousand citizens, while her Italian colleague represents 400 thousand voters.
But let’s try to imagine a more proportional European Parliament, where all votes are counted equal. How would it look like?
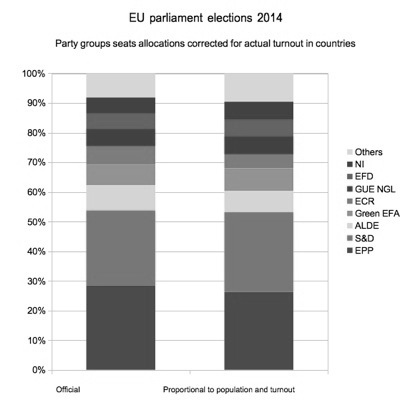
Well, ‘pure’ proportional representation in May 2014 would topple the incumbent giving the victory to S&D group, albeit for a handful of seats, over EPP (27 percent against 26,2). Given the symbolic meaning attached during the electoral campaign to the spitzencandidaten and the nomination for the European Commission president, this is not just a detail.
ALDE would sink even further to 7,2 percent, ending behind the Green/EFA’s 7,6 percent. The ‘Others’ – new parties non allied with existing political groups in the outgoing parliament – would gain more that a full percent point. Smaller changes would be recorded for the other groups.
This sounds like history written with ifs, doesn’t it? Still, with the EU democratic deficit – however defined – looking every year as deep as the the public debt of many of his member states, a proportionality therapy could try to bridge it.
Methods
The calculation would be straightforward, albeit laborious, if we had the actual votes given by citizens to each party in each country and then treating the whole EU as a single constituency for best proportionality. For all its usefulness, the europarl.europa.eu website provides only relative results, i.e. as percentage. For previous elections there are excellent sources like http://www.nsd.uib.no/european_election_database/ and the individual electoral authorities have their own websites where the results have been published.
Before harvesting the actual data from each and every national website, I am presenting here a first quick and rough estimate, based on the existing seats won by EU-wide party groups in each country. I will proceed as follows:
a) Calculate a revised total number of seats for each country based on the number of ballots cast, while keeping the total at 751. As a proxy of the actual votes cast, I take the total population multiplied by the turnout rate for each country (thus implicitly assuming the same demographic structure for all countries and slightly over-representing ‘younger’ countries).
b) Recalculate the seats for the political groups within each country based on their ratios in the official distribution that is being published on the EU parliament website, but relative to the revised number of seats for the country as determined in (a). In order to avoid rounding problems, the revised number of seats will not be integers and presented only as percentage.
So here are the results in the would-be proportional EU:

This work is still in progress and it will be regularly updated as official data are released.
Update: see the follow-up article


